

Under normal conditions in the housing market, “for sale” listings drop when there is a rise in sales. Over the last year, however, listings have actually risen despite a moderate increase in sales numbers—as shown in the first chart (below).
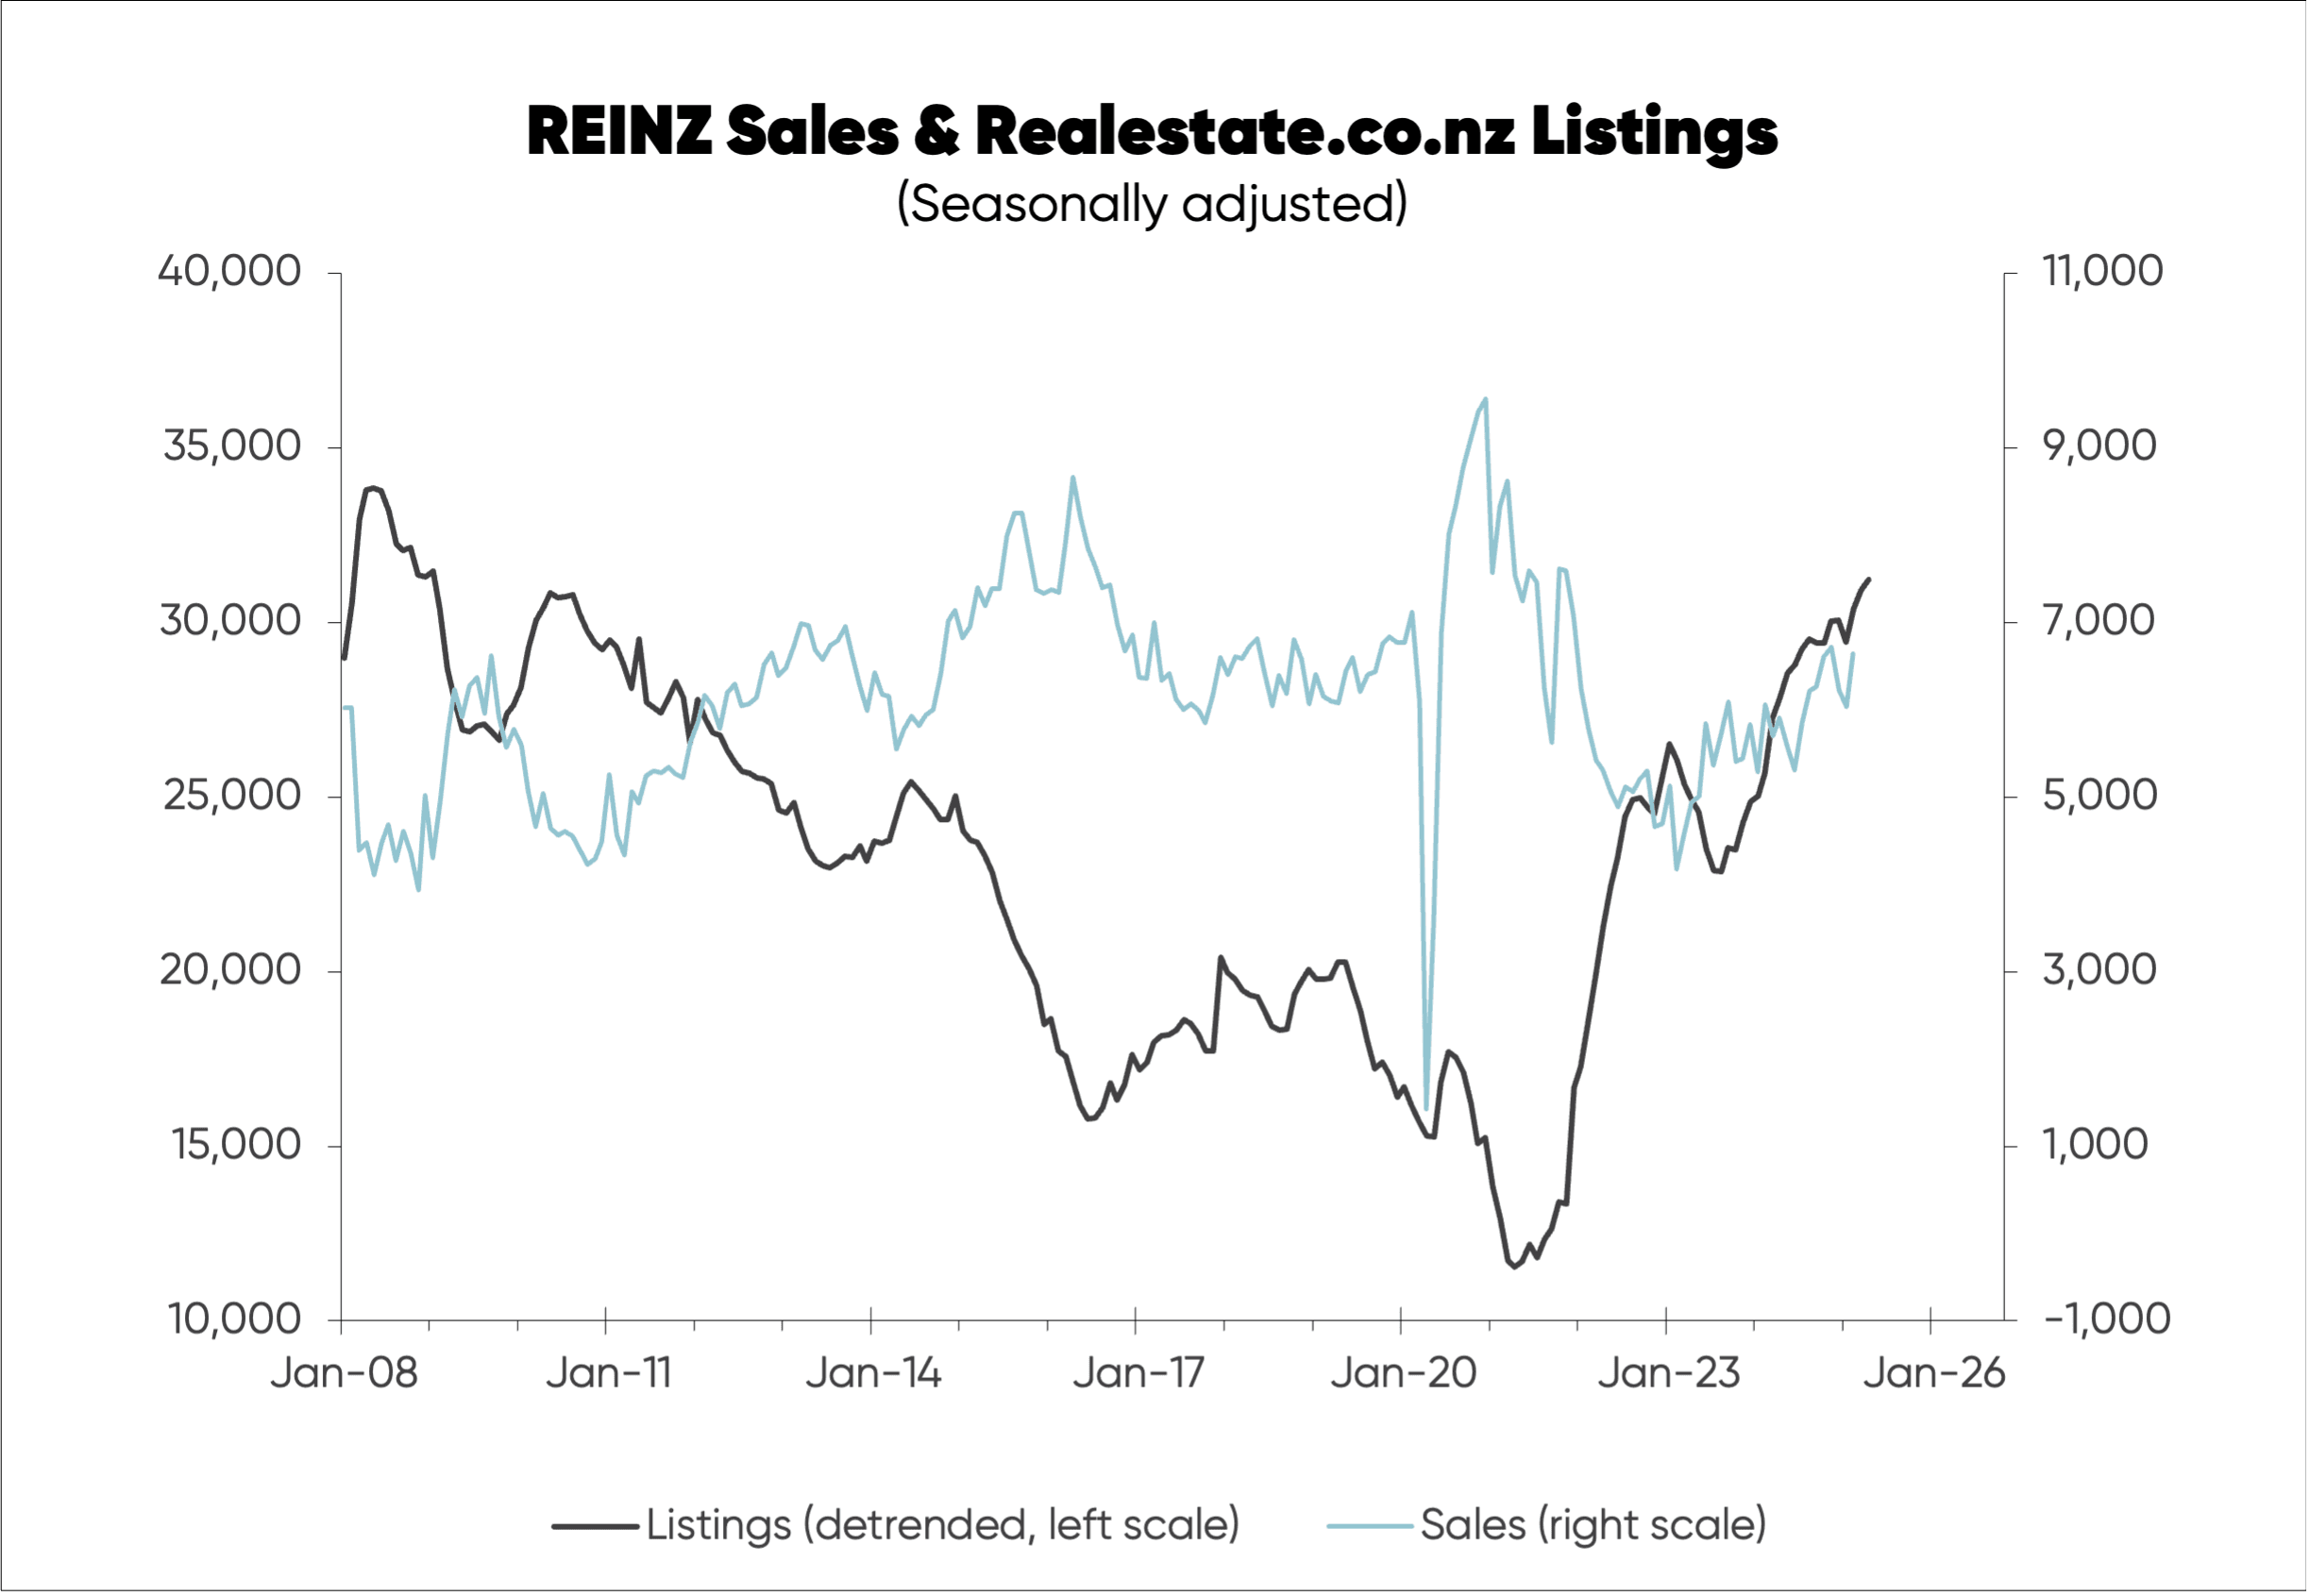
While sales are now back to around average levels, listing numbers are still well above average, stalling the case for a rise in house prices.
Instead of rising mildly-to-moderately now, the national average house price has increased only slightly, a fact which may just reflect random variation based on the REINZ NZ House Price Index (see the second chart).
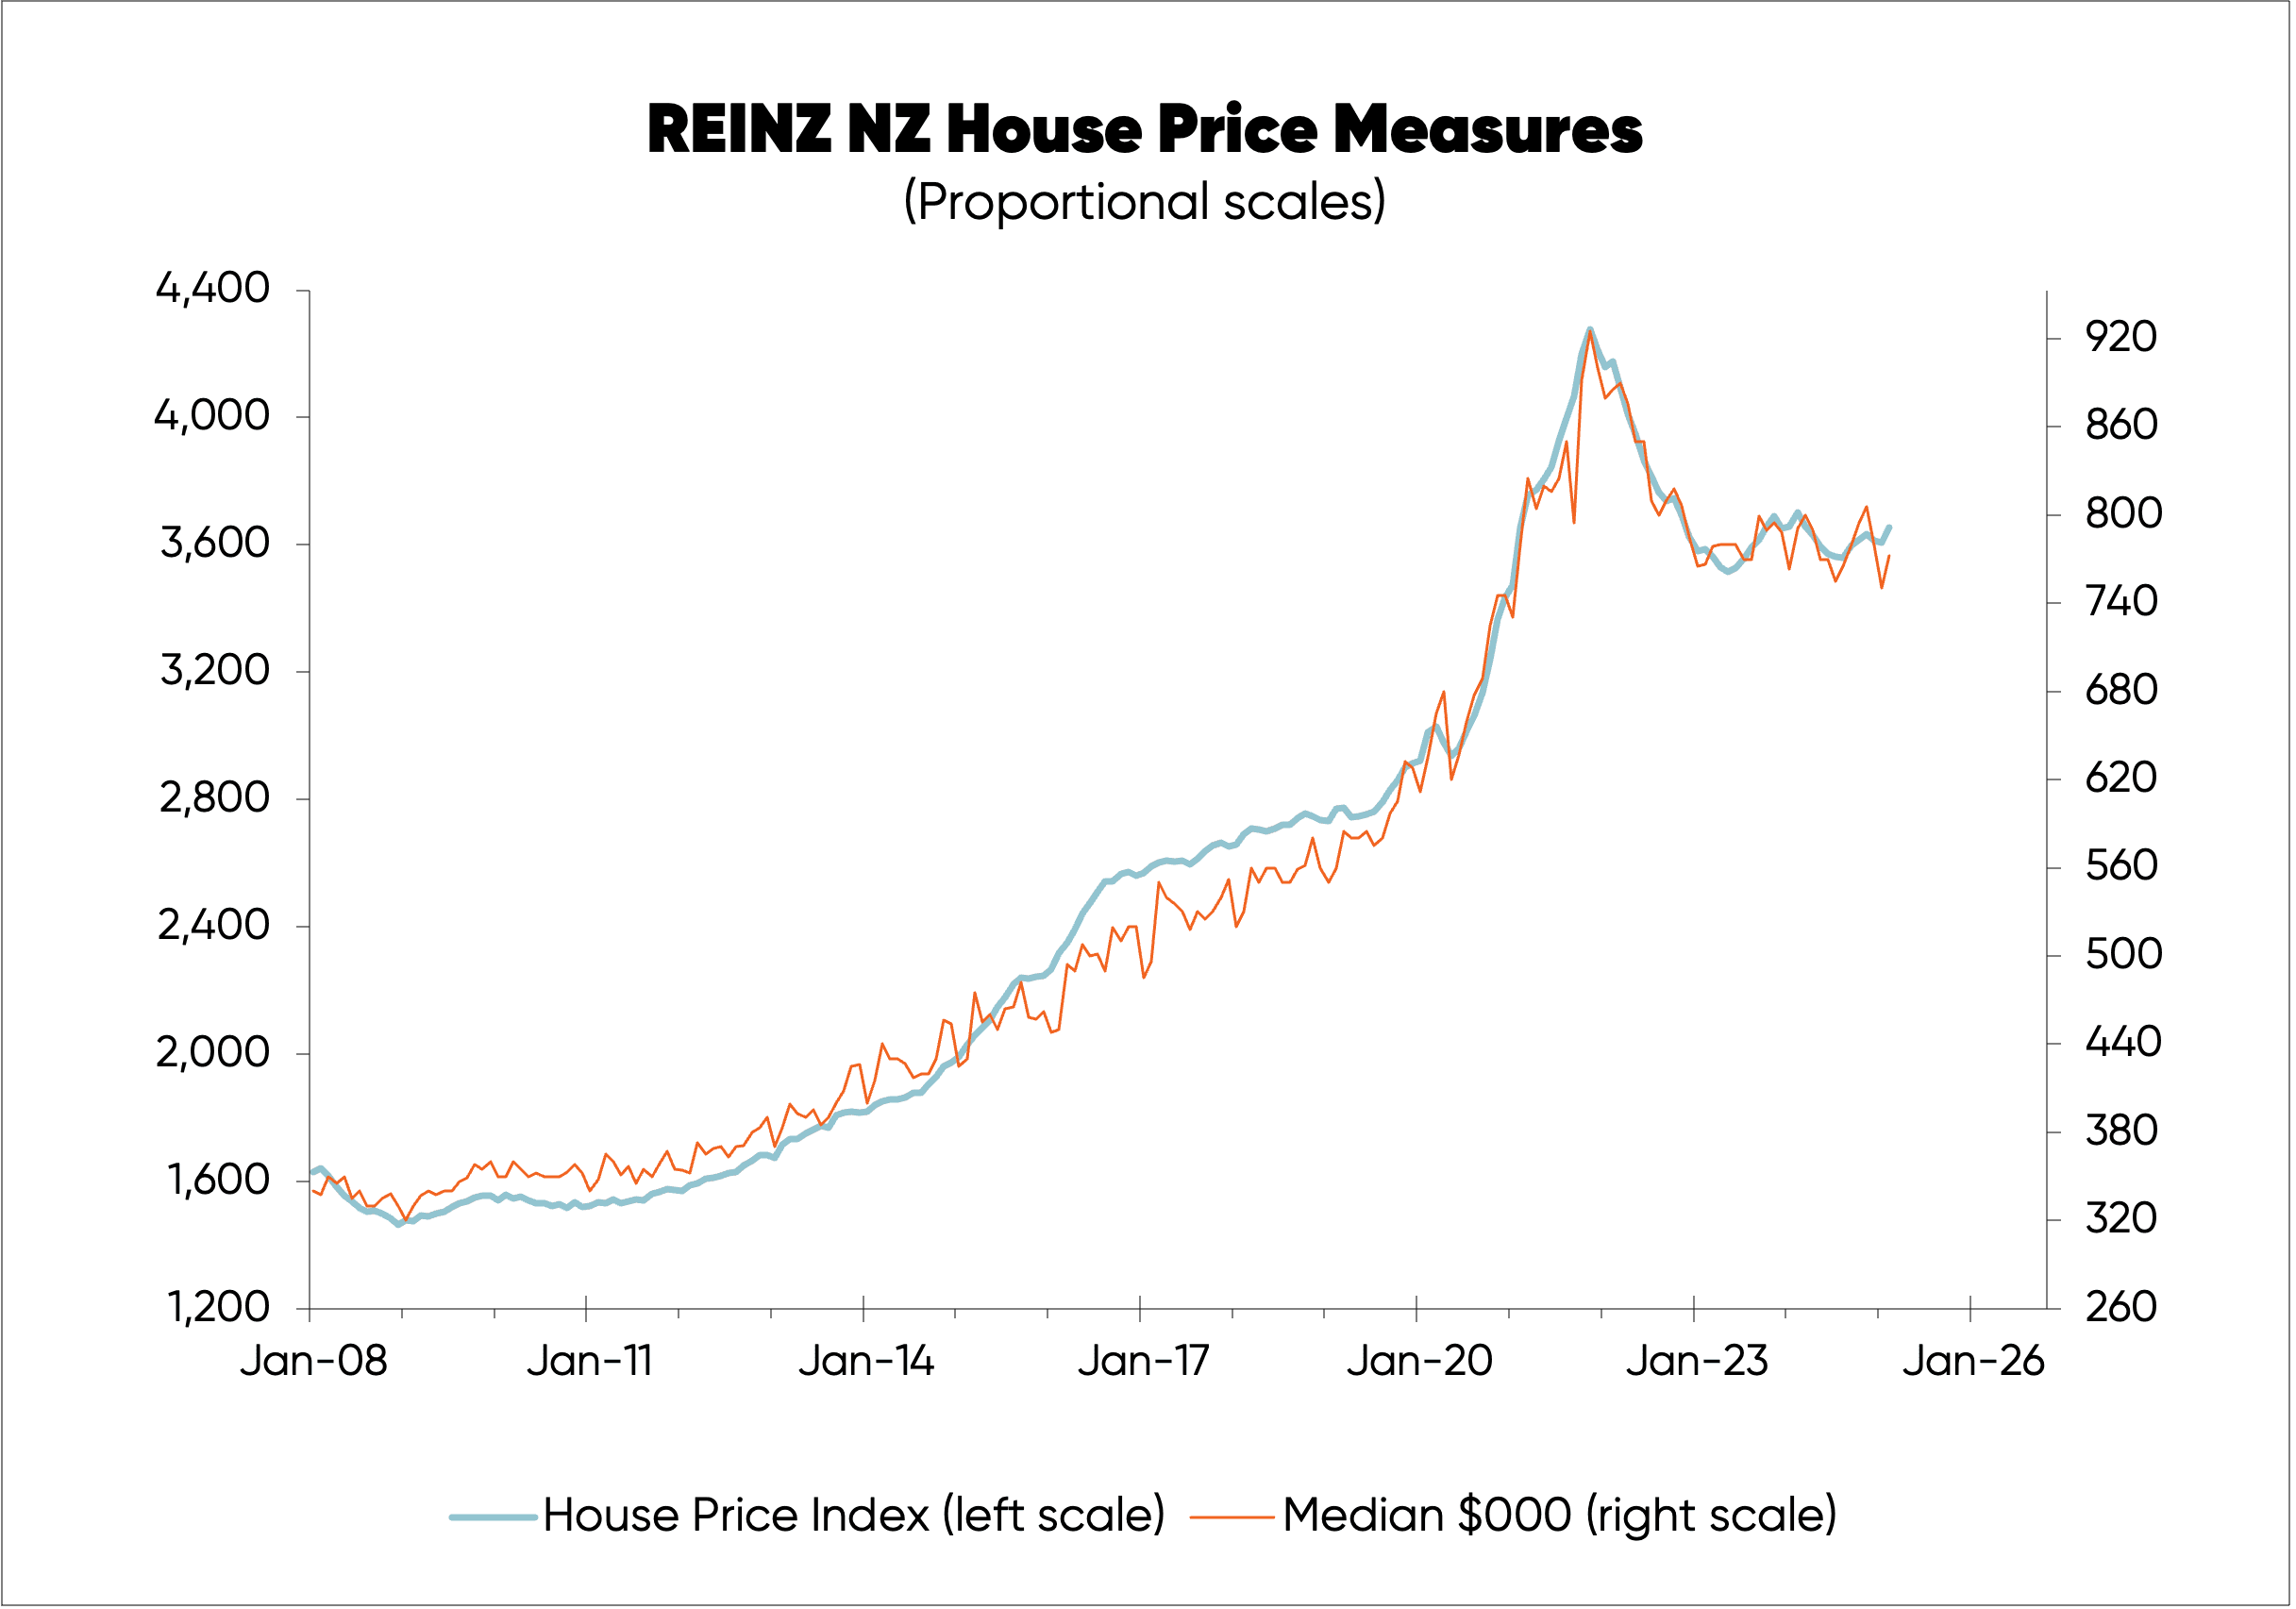
The REINZ HPI is a better measure of price behaviour than the REINZ median price, which is impacted by changes in the composition of sales from month-to-month, making it much more volatile and less reliable as in indicator of short-term price movements.
If listings had behaved normally and fallen in response to the rise in sales last year, there should currently be roughly 5,000 (or 16%) fewer for-sale listings. House prices, meanwhile, should be rising at a mild-to-moderate pace now with potential for 10% growth (or thereabouts) this year.
Instead, the national average house price has only shown a hint of upside, based on the REINZ House Price Index, and it seems likely that we’ll see only around 5% upside this year. Listings have been de-trended to adjust for structural changes in the market; particularly a fall in multi-listings (i.e. listing with more than one agent) in the 2010s.
A few factors are driving this unusual behaviour. Population growth has slowed more than the fall in new building completions, creating a temporary surplus of housing, partly reflected in limited upside in national average rents in the last year. Additional factors include:
- The late-2018 ban, preventing foreign buyers (including those with work, student, and long-term visitor visas) from purchasing existing dwellings.
- The high level of Kiwis departing New Zealand, some of whom will be selling property.
- And non-Kiwi immigrants may live more people per dwelling than departing Kiwis, reducing need for housing.
A driving force behind the Kiwi exodus, and also lower immigration, is the fact that unemployment has risen further in NZ than Australia (see the third chart below).
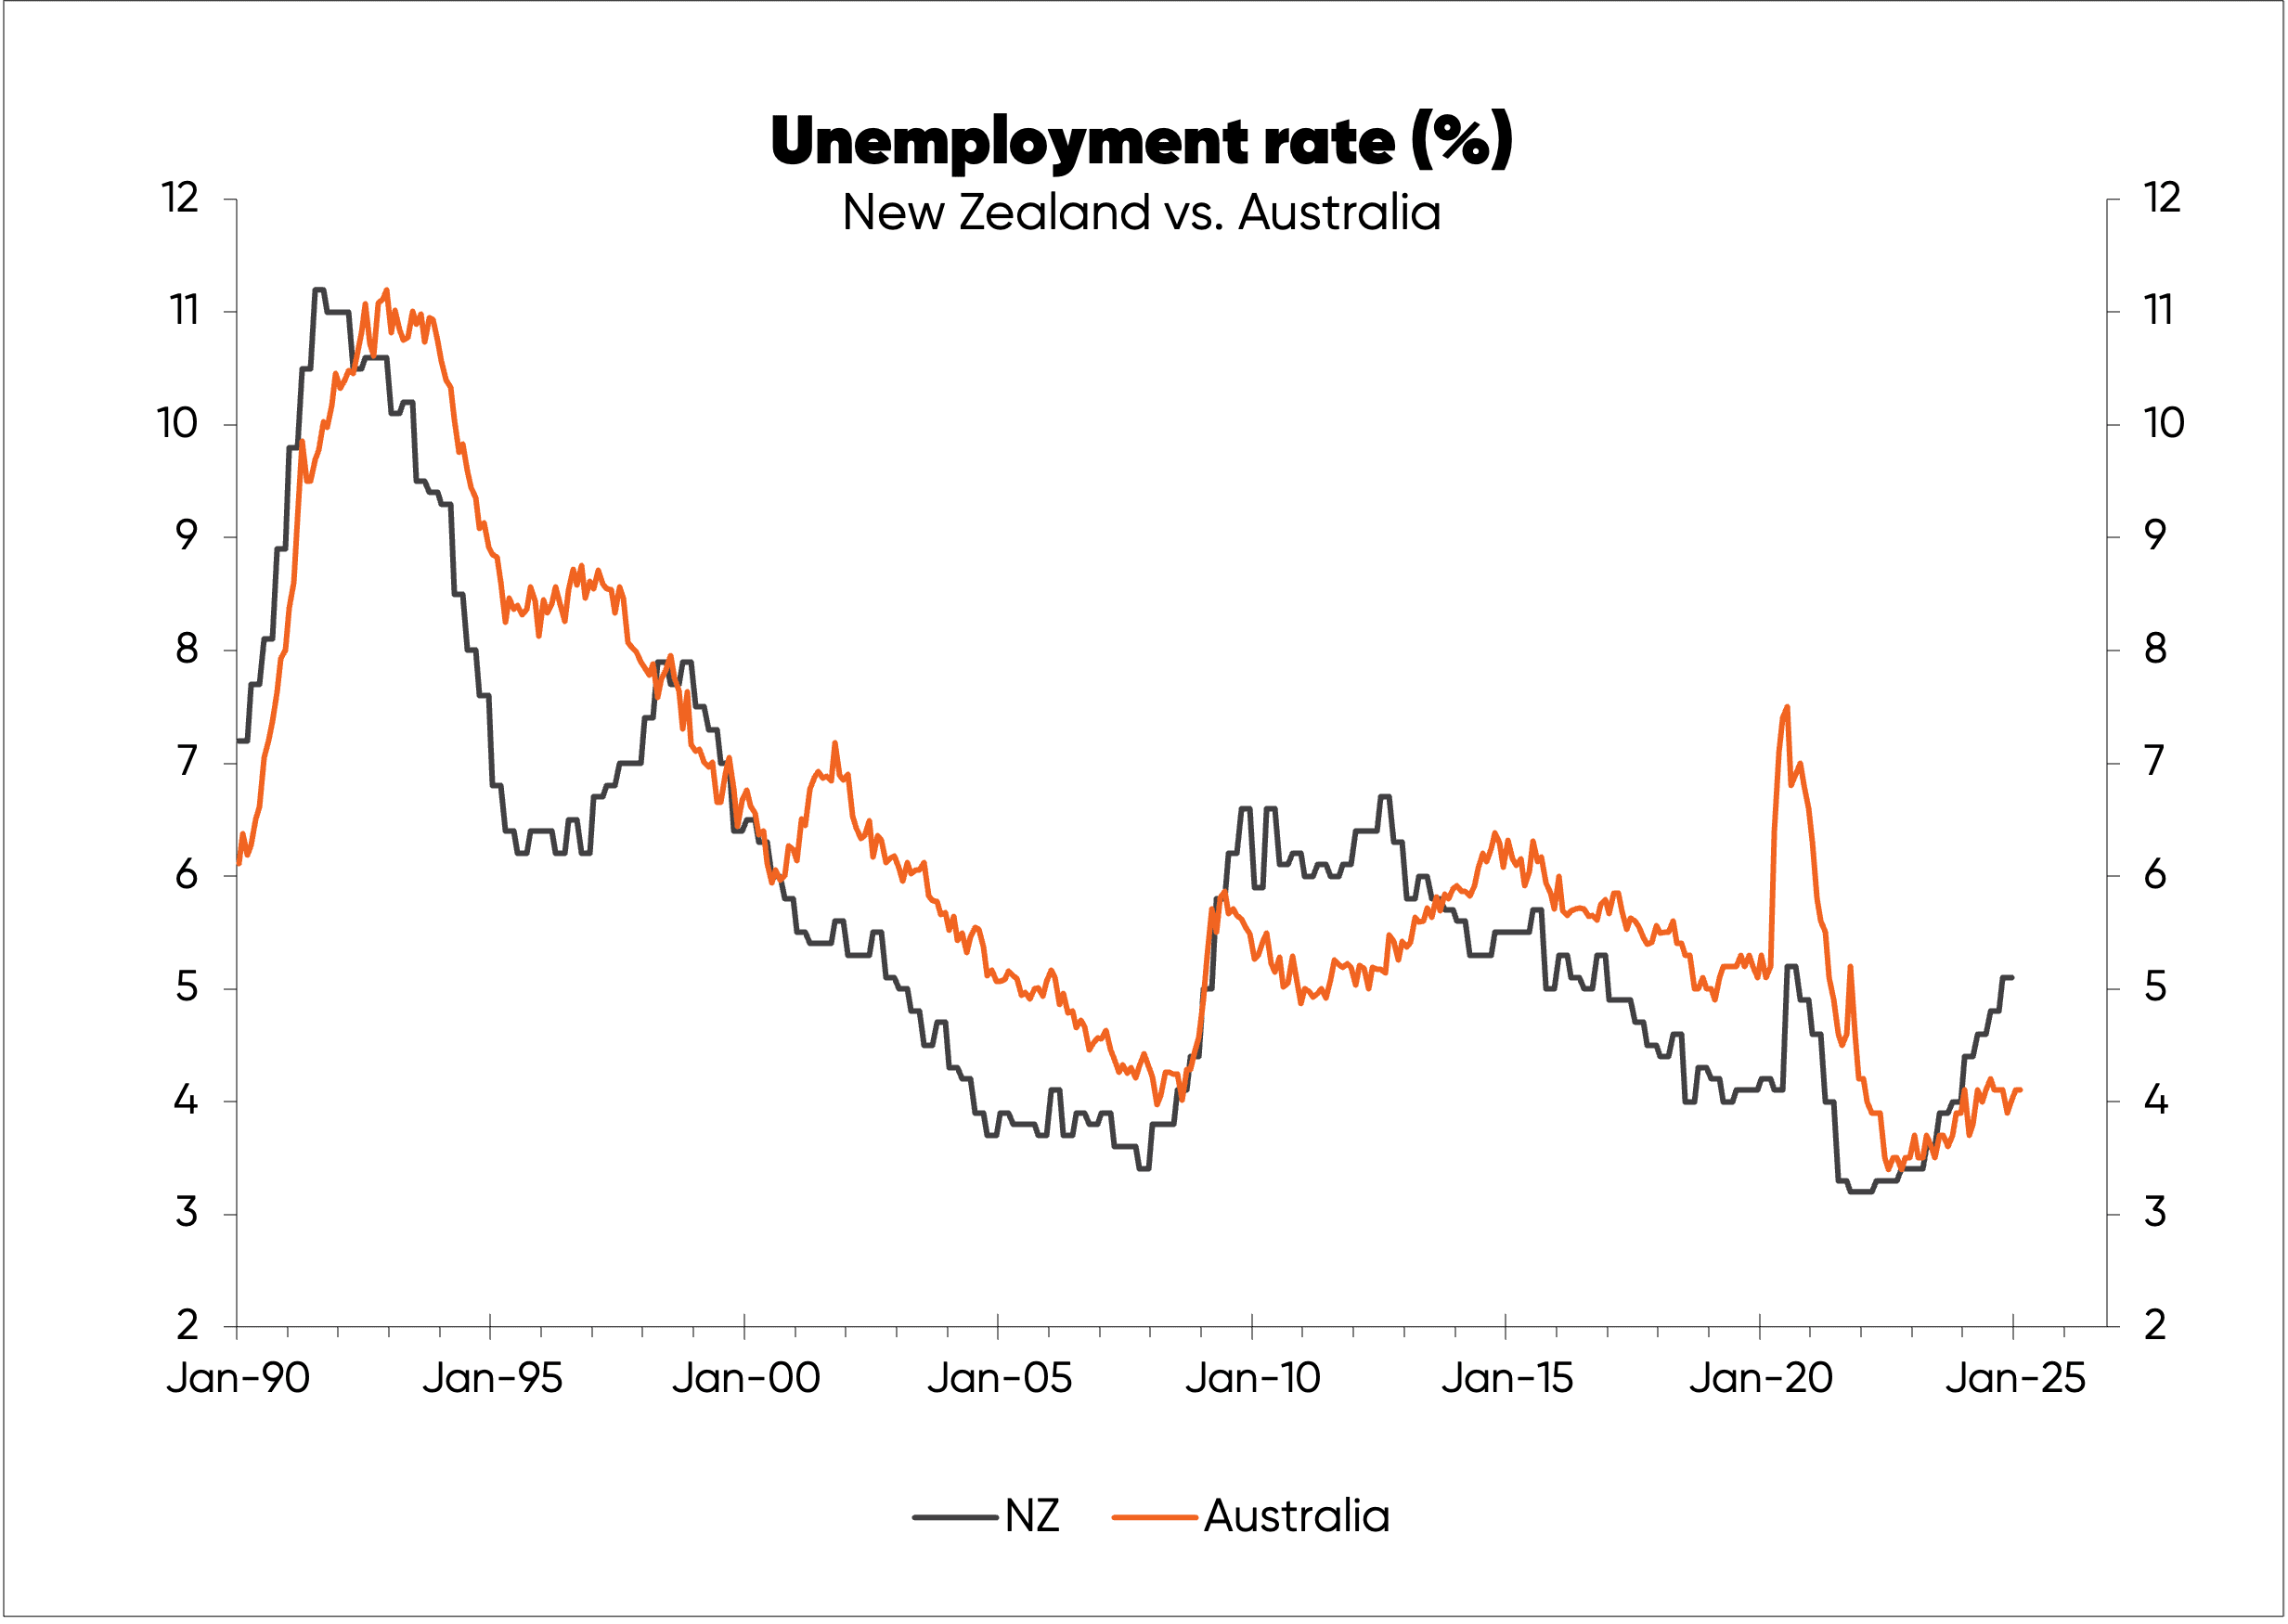
In fact, unemployment has risen much more in NZ than most countries, largely due to the Reserve Bank having fought a more aggressive (potentially overkill) battle against inflation. It will also be reflected in worse prospects for pay increases in NZ.
That does, however, mean that NZ has made more progress in taming inflation—which, in time, should lead to a larger fall in interest rates, and should help turn the tide for net migration as NZ’s economic growth prospects improve.
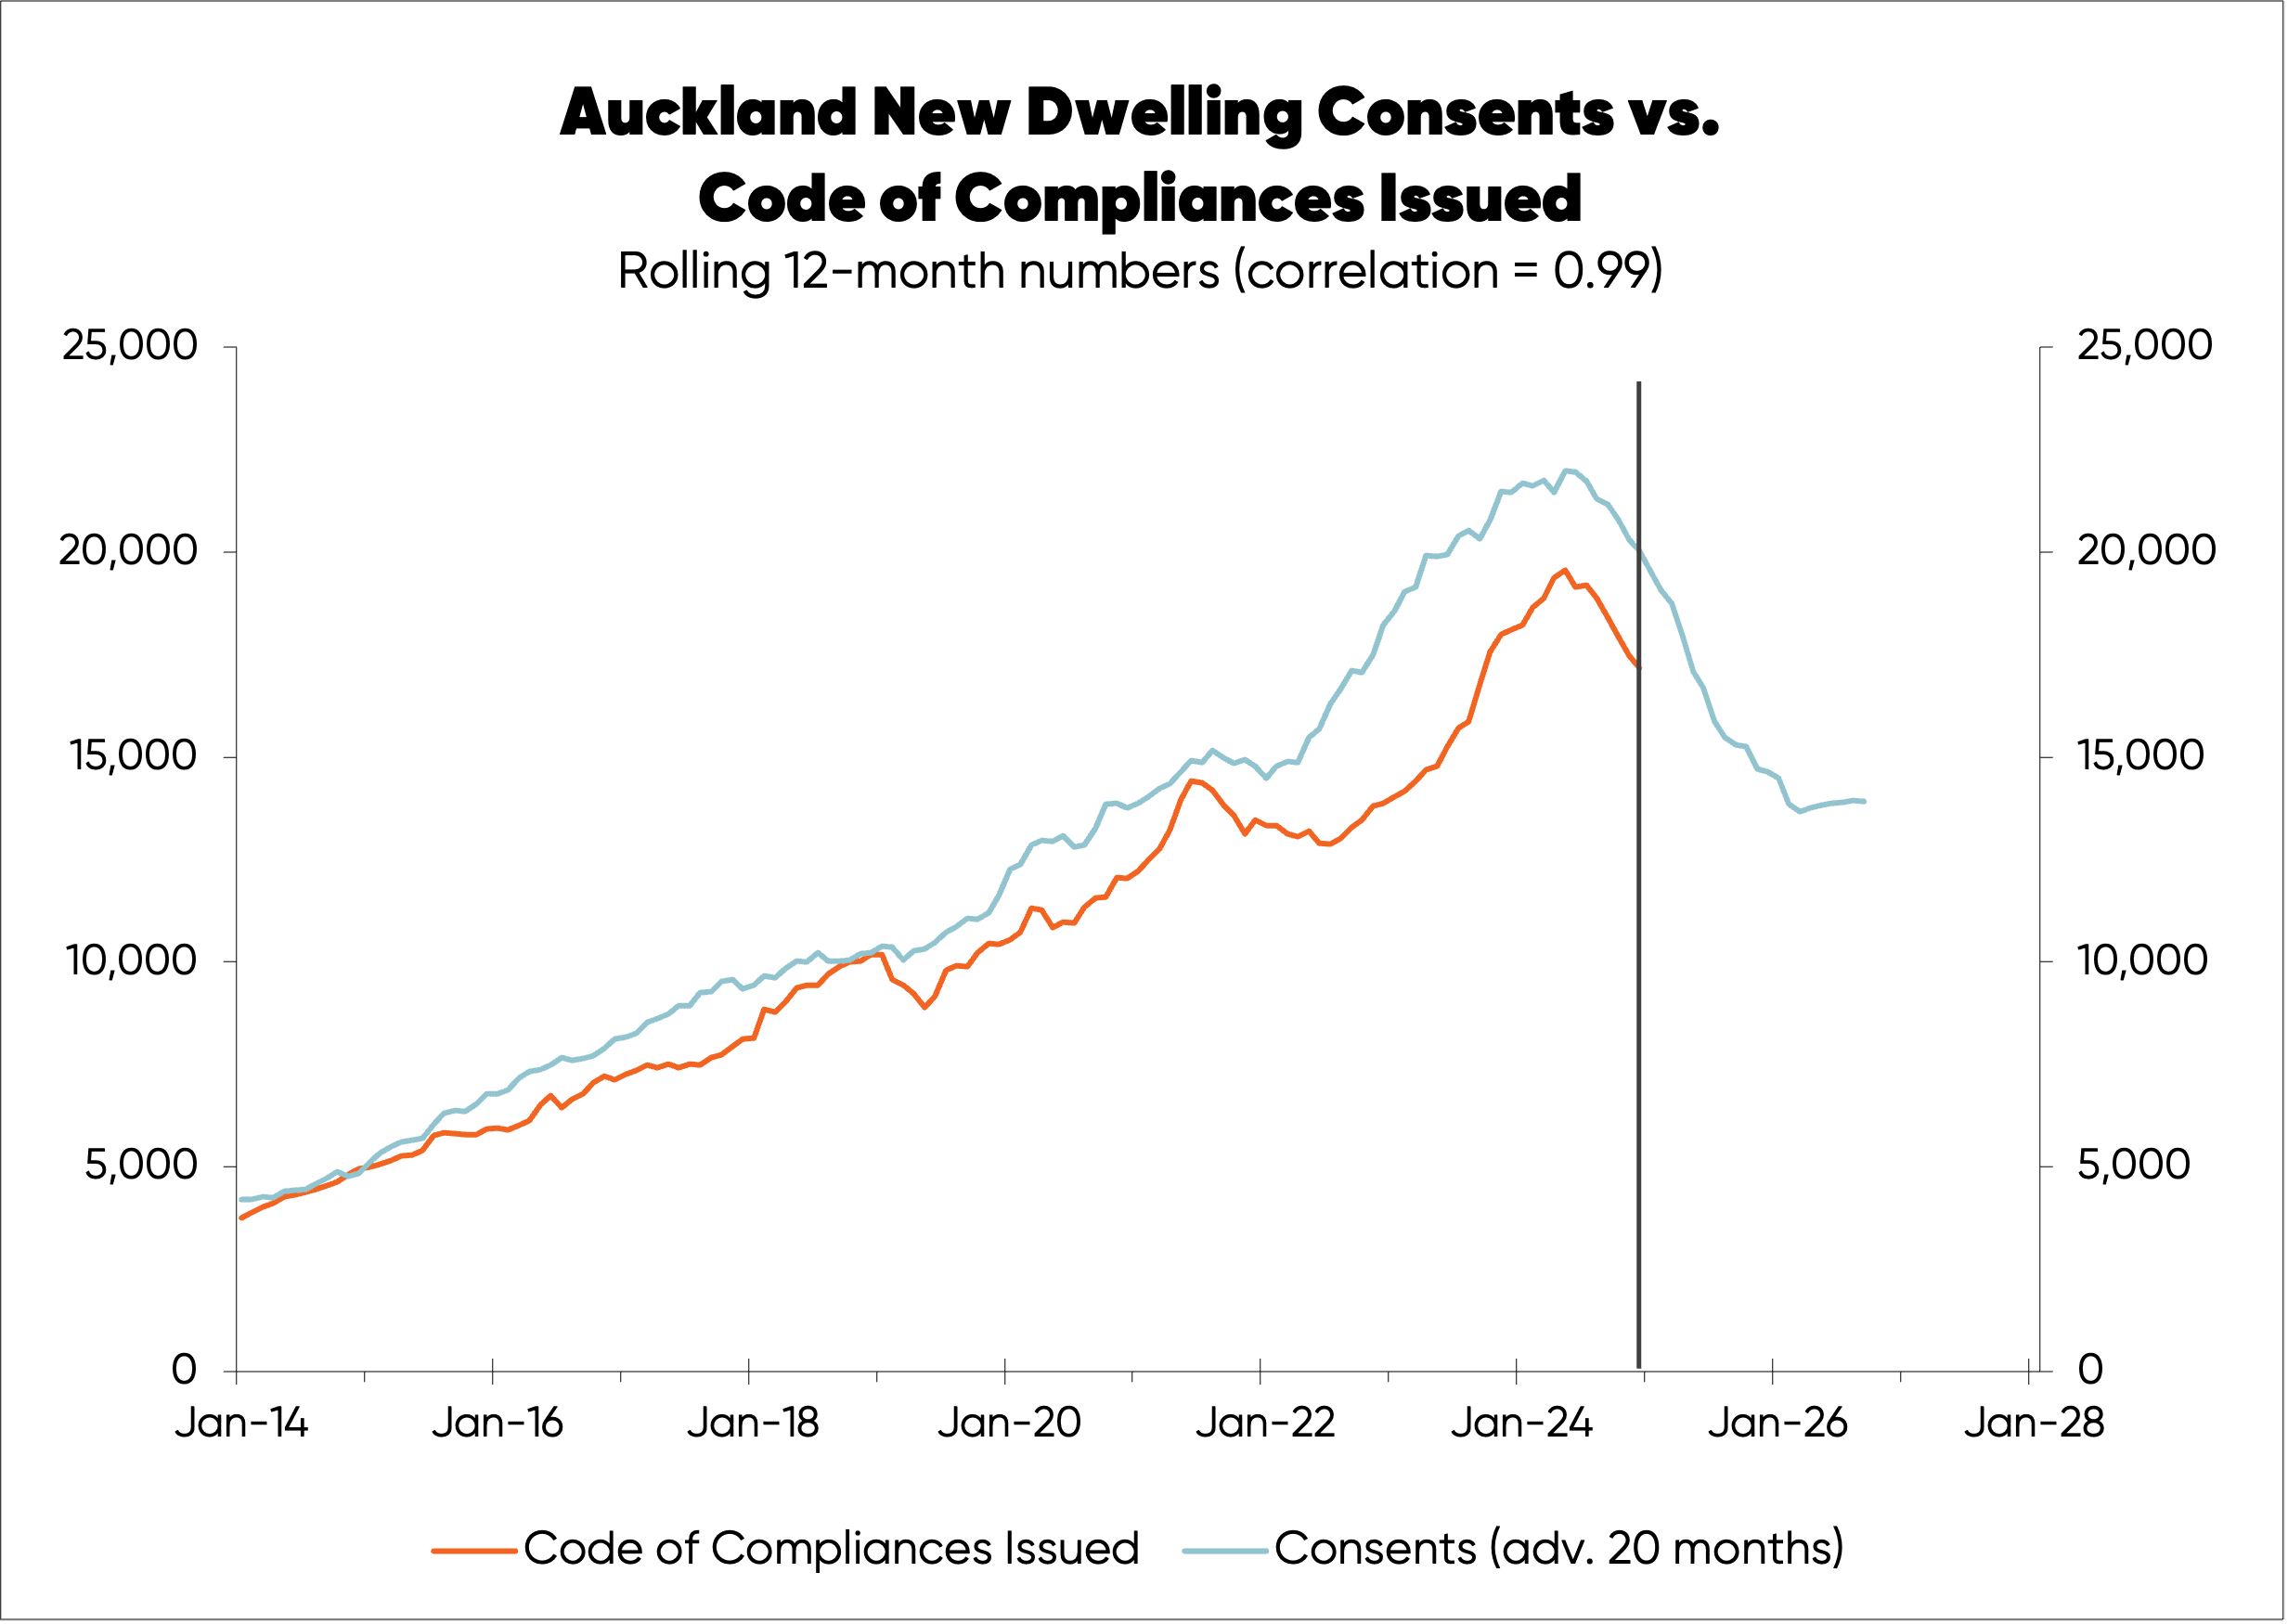
With new dwelling completions starting to follow the large fall in new dwelling consents, the oversupply of housing should abate. This is shown for Auckland in the fourth chart, below, with the best fit being with consents advanced or shifted to the right by 20 months.
The main factors behind the unusual behaviour of for-sale listings should abate this year and potentially even further in 2026, while interest rates should fall more given the Reserve Bank seems likely to cut the OCR at least a bit more.
The case for rising house prices will improve although not as much as in past cycles because the Reserve Bank’s debt-to-income ratio limits on new mortgages (implemented last year) are likely to somewhat constrain price increases potentially starting next year.
By Rodney Dickens, Managing Director, Strategic Risk Analysis Ltd www.sra.co.nz.